Last updated on March 2, 2024
Looking for a winning lottery formula? Well, mathematics remains the only sensible solution you can rely on. Here’s how to win the game—make an intelligent choice and be wrong less.
Here, you will discover logical realities derived from proven principles of probability theory, combinatorics, and the law of large numbers or LLN. I will prove everything using the actual results of the lottery. Numbers don’t lie.
So get some coffee. This article is a long one. Without further ado, let’s begin.
Table of Contents
Lottery Formula And Realistic Expectations
Winning the lottery is difficult. The astronomical odds are not the only reason you are not winning. Those mistaken beliefs surrounding the lottery may have been holding you back from achieving lottery success.1
Playing the lottery is like a war. You must know the enemies, plan a strategy, and execute the attack to win the war.
No one describes it better than Sun Tzu:
The general who wins the battle makes many calculations in his temple before the battle is fought
Knowledge is power. So, I will introduce a lottery formula to help you understand how numbers behave in a random game like the lottery.
Lottery games as a form of gambling
The lottery’s whole idea is plain and simple — you play just for fun (for a cause). You want to give it a shot at the tease of “what if” you hit the jackpot. That’s absolutely what makes a lottery game exciting.
If you win, great! You’re on your way to a life-changing journey. But if you lose, at least you helped your community in such a fun way.
You see, your losses are just the price of the entertainment. Much the same way as concert and cinema tickets are the price of a good time.2
Since the lottery is just entertainment, you should only spend the money you can afford to lose. The lottery odds are designed to put you on the losing side for most draws.
You may have heard you should frequently focus on winning small ones to win the jackpot. This statement misleads many players. Lotto players are usually vulnerable to manipulative biases.3
That is, players get too excited about recent wins (availability bias).4 Then, they tend to emphasize the winning instances and ignore the many instances of loss (confirmation bias)5. So, some lotto players think it’s possible to profit from winning small prizes. As a result, they fell into an illusion of control over the game.6 Humans are very susceptible to this fallacy.
In mathematics, your odds of winning the jackpot prize are one against all the many possible ways you fail.

The equation is simply the ratio of success to failure.
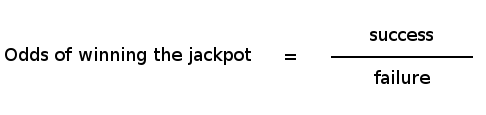
For example, in the US Powerball 5/69 game, you get only one success against the 292 million ways you lose. So, no matter what guarantees someone promises you, the underlying probability never changes.
In the lottery, the expected value is always negative.7 In other words, it’s never a profitable exercise.
The best way to explain it is through the probability of losing.
The average probability of winning a prize in the Powerball game is 1 in 24.87. So, the probability of a single ticket not winning any prize is about 0.9598.
P(losing) = 0.95978376792557
Our calculation means that about 96 of the 100 Powerball tickets you buy will be losers. You need to buy at least 17 tickets to get a 50/50 chance of winning.
P(50/50 chance of winning any prize) = 0.959817 tickets
And to guarantee a 99.99% chance of winning any prize, you must buy 224 tickets. We calculate this using P(winning any prize) as the complementary of P(losing).
P(winning any prize) = 1 – 0.9598224 tickets = 0.9998
Unfortunately, according to the payout scheme of the Powerball game, you will most likely win $4 because the probability leans toward the lowest-tier prize.
However, despite the odds stacked against you, all hope is not lost. A lottery formula must look upon randomness as the key to lottery success. You should be thankful that the lottery is truly random.
What to do as a lotto player?
When you consider the money you are spending on the lottery, you might as well play it right.
No amount of superstition will ever help you become a national lottery winner one bit. No super machine, artificial intelligence, or psychic phenomenon (if that even exists) will help you know the lottery’s prior results.
When a magical power doesn’t exist, mathematics remains the only tool you can use to help you pick combinations with the best shot possible.
However, your ability to handle knowledge responsibly is the most important thing to consider. As Uncle Ben said, with power comes great responsibility.
In short, have fun but play responsibly.8
In the name of transparency, I don’t play the lottery. I know your next question will be, why should you listen to me?
As a computer programmer and a stock market investor, I have learned from my profession how important math is in decision-making.
It piqued my curiosity to apply math to it and see what works. I use various mathematical methods to analyze the lottery, and I don’t need to be a lottery player to prove my point. With the lottery’s randomness, it is possible to create a lottery formula that will help you win the game.9
I am just basically sharing the results of my research.
The good thing about mathematics is that we can prove if a lottery formula works by comparing mathematical theory with historical results.
Numbers, Combination, and the Difference
Numbers and combinations are two different terms.
A number refers to an individual ball in the lottery. Conversely, a combination is a selection of numbers that, when put together, form a specific composition.
You cannot win a lottery game with just a number. You have to combine numbers to win.
For example, 3,15,27,39,41, and 49 are all different numbers. But when they are put together, they form the combination 3-15-27-39-41-49, perfectly describing a 6-odd composition.
The following are some examples of combinations:
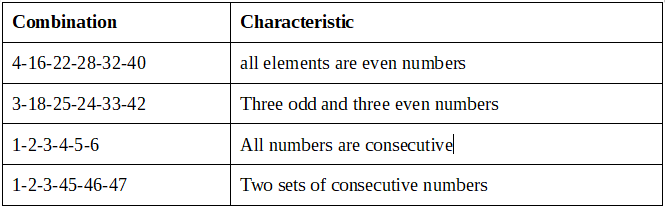
When playing a lottery game, you can choose any number you like. Yes, including those numbers that you consider are unlucky.
But you have to choose 5 or 6 numbers to make a combination to purchase a legitimate ticket.
All numbers have an equal probability.
Mathematically speaking, hot and cold numbers don’t exist.
You will notice that some numbers tend to be drawn more frequently in a few draws. However, as the number of draws increases, all the balls tend to even out. Then, some of the numbers left behind later on catch up.
This event is described in mathematics as the law of large numbers or LLN.10 The law means that the frequency of each ball tends to get closer and closer as more draws take place.
To illustrate, let’s look at the actual results from the Canada Lotto 6/49 From 1982 to 2018.
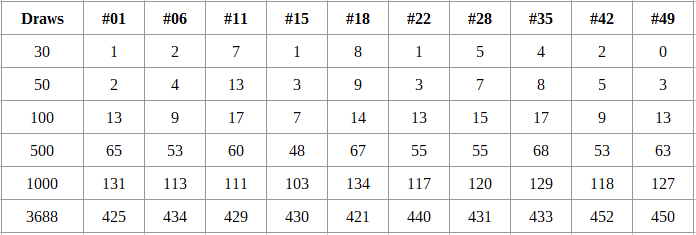
The table shows the frequency of 10 balls (1,6,11,15,18,22,28,35,42,49) taken from 36 years of actual data.
In the initial 30 draws, you can see the huge gap between numbers 18 and 49. You will notice the same thing with other numbers as well.
Here’s a pie graph to show the huge difference in frequencies in the first 30 draws of the Canada Lotto 6/49.
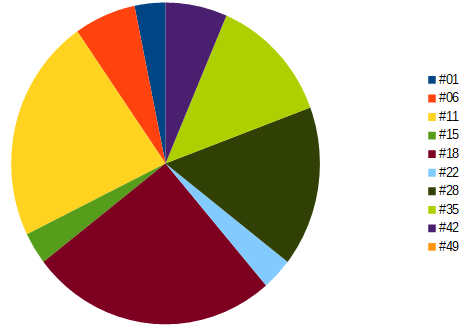
Numbers 11, 18, 28, and 35 get the lion’s share of the pie.
As the lottery draws occur, those less frequently appearing numbers start to catch up. The pie graph below shows the improvement of other numbers in 50 draws.
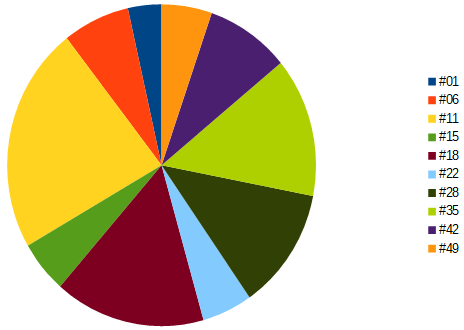
In 100 draws, numbers were starting to even out.
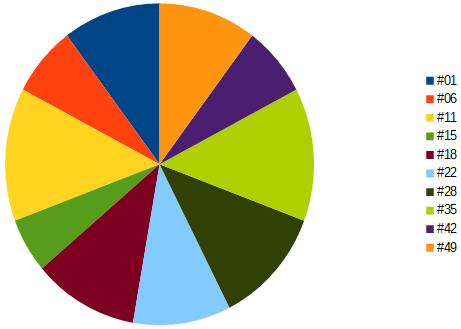
And the frequency balances out as draws continued to 500 draws.
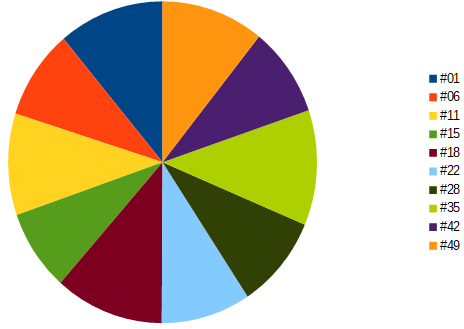
And the frequency continues to get closer and closer in 1000 draws.
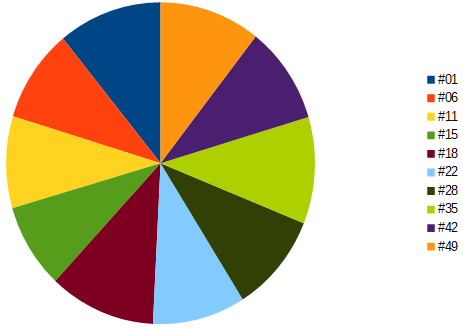
Fast forward to 2018, the pie graph continues to show no bias at all.
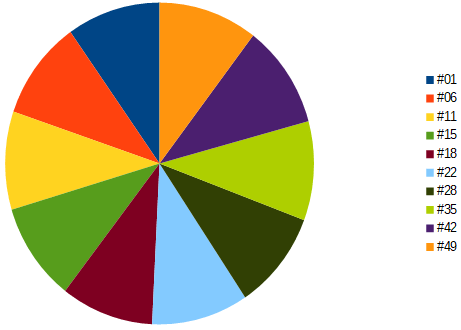
The last pie graph proves that all the numbers in the lottery have the same probability.
Notice that we don’t include all the balls in the pie graph for lack of space. But if we have to get the frequency of all the 49 balls in the 3688 actual draws, the graph should look like the one below:
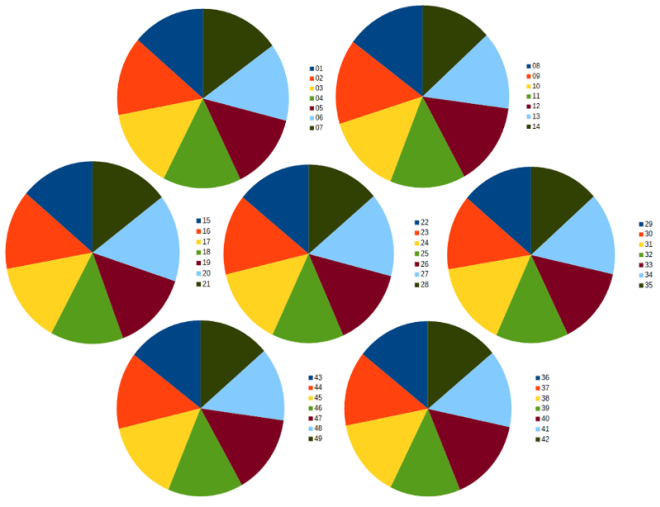
It’s beautiful! Isn’t it?
The graph proves that all numbers have a fair chance of getting drawn. In other words, there are no lucky and unlucky numbers.
Now, if lucky, hot, and cold numbers don’t help, what does?
It’s the combination.
The way you combine numbers is the key to your lottery success.
The Existence of a Lottery Formula and The Great Lottery Misconception
All combinations in the lottery have an equal probability of getting drawn because there’s only one way to win the jackpot. So, does that mean 5-10-15-20-25-30 is equally likely? Well, yes. That’s because, theoretically:
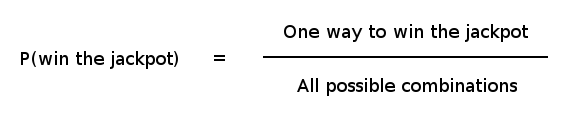
The same calculation applies to 1-2-3-4-5-6 or 2-4-6-8-10-12.
Consequently, many players and experts believe the lottery has no bias; therefore, it doesn’t matter what combination you use.
That belief must be corrected.
Let me explain.
Are you willing to bet your money on a ticket with 5-10-15-20-25-30 or the 37-38-39-40-41-42 ticket?
You’ll probably answer, “No way.”
But here’s the thing: if you stand up firmly and say those combinations are as likely as any other in the lottery, why worry?
Is it because a gut feeling is much stronger than logic?11
Will you trust your “gut” or your “logic?”
Either you don’t trust your calculation, or your understanding of probability is based on a weak foundation.
A strategy based on a “gut feeling” shouldn’t be superior to mathematical reasoning.
In mathematics, all these seemingly “weird and surprising” events are bound to take place because a random lottery must follow the dictate of the law of truly large numbers.12
So while the combination 1-2-3-4-5-6 is possible to occur, understand that your ability to win the jackpot is crippled because you need a truly large number of draws to get a favorable shot.13
You don’t want to be wrong like this. You can’t create a lottery formula with intuition.
The truth, thousands of unusual combinations exist in your game, and you probably spent your money on one of them.
It’s best to know why things happen and why things don’t.
As you proceed below, I will explain this “gut feeling” thing mathematically.
A lottery formula exists because combinations are not created equally
You have to understand that a combination is a composition of numbers.
And composition matters.
We can separate the dominant composition using probability theory and combinatorial mathematics. An effective lottery formula should be based primarily on these two mathematical tools, and we can safely disregard statistics.
Below are examples of composition in a lotto 6/49 system.

If we want to know how these two groups will occur in 1000 draws, we only need to multiply this number by the corresponding probability.
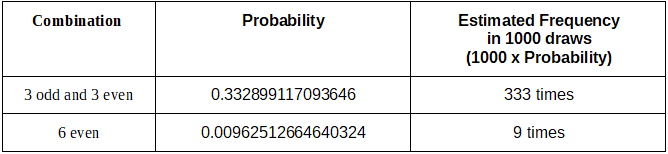
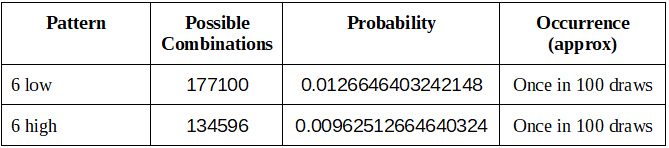
As you see, 3-odd-3-even combinations occur more frequently than 6-even combinations.
The two combinatorial groups don’t perform the same way. The variation in composition plays a vital role in their expected frequency.
This variation in composition provides varying success-to-failure ratios.
What is a success-to-failure ratio?
It’s easy to answer that question if we understand that odds and probability are two different terms with two different equations.14
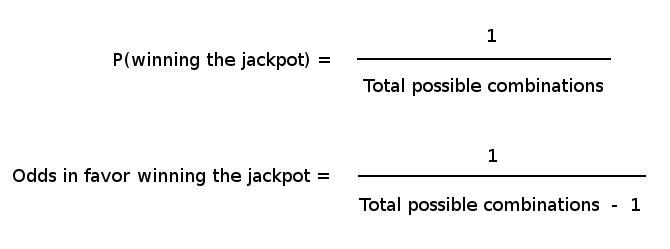
Probability measures the likelihood of an event, while the odds refer to the ratio of success to failure.15
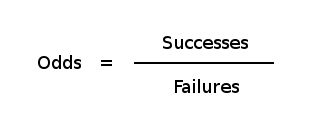
Simply put, we don’t have control over the probability of winning. But we have the power to choose better odds.
There are 4,655,200 ways you can combine 3-odd-3-even combinations. So, 333 of 1000 draws will put you in a 1:2 advantage.

That means for every 100 attempts you play, approximately 33 are favorable shots to match the winning combination.
In comparison, 6-even combinations will give you nine favorable shots in 1000 draws. That means if you play 2-4-6-8-10-12, expect only one favorable shot after having 103 attempts.

As a lotto player, I don’t think you will be willing to spend money and then see your money going down the drain for most of the draws.
Let me compare the two compositions side by side:
| 6-even-combination | 3-odd-3-even-combination |
| 134,596 favorable shots | 4,655,200 favorable shots |
| 13,849,220 ways to fail | 9,328,616 ways to fail |
| 1 favorable shot out of 104 attempts | 33 favorable shots out of 100 attempts |
| 1:103 | 1:2 |
The table indicates that the 3-odd-3-even composition is the dominant group based on its success-to-failure ratio.
As you see, a lottery formula is all about choosing a better ratio of success to failure. You need this strategy to know how many ways you get favorable shots and be wrong less for most draws.
You cannot change the underlying probability, and you cannot beat the lottery’s odds, but you have the power to be wrong less. Simply put, getting the best shot possible is all about picking a composition with more favorable shots. This strategy is better done using the success-to-failure ratio.16
Low/High Combinatorial Analysis
Of course, aside from odd and even numbers, the lottery’s number field can be grouped into low and high. Let’s group 49 numbers into two sets:
Low = {1,2,3,4,5,6,7,8,9,10,11,12,13,14,15,16,17,18,19,20,21,22,23,24,25}
High = {26,27,28,29,30,31,32,33,34,35,36,37,38,39,40,41,42,43,44,45,46,47,48,49}
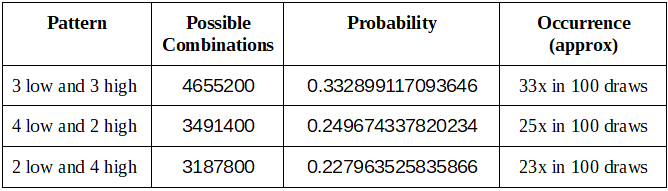
A random lottery game spreads the probability fairly across the entire number field. Thus, most winning combinations consist of 3 numbers from the lower and three from the higher set.
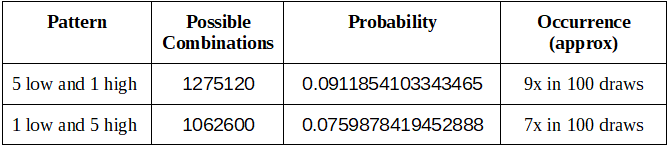
It’s rare to see a winning combination composed of purely low or purely high numbers because the probability cannot be biased toward a certain set.
Consequently, the 3-low-3-high composition dominates lottery draws. Therefore, lotto players must focus on this dominant group to get the best shot possible.
Below are the tables showing all the groups we can produce from the two sets.
Dominant Groups
Occasional Groups
Uncommon
Actual Draws Versus Theoretical Calculation
Theoretical calculation and lottery results agree that combinatorial groups are not created equally. Some are dominant, and some rarely occur.
Take a look at the following tables below:
Australian Saturday Lotto
827 draws from January 7, 2006, to November 13, 2021

U.S Powerball
646 draws from October 7, 2015, to November 13, 2021

Note: Our analysis of the U.S. Powerball must start on October 7, 2015, because this was when lottery officials began implementing the 5/69 format.
Euro Millions
1,461 draws from April 16, 2004, to November 12, 2021

Euro Jackpot
503 draws from March 23, 2012, to November 12, 2021

Irish Lotto
646 draws from September 5, 2015, to November 13, 2021

U.S. Mega Millions
409 draws from October 31, 2017, to November 12, 2021

Note: Our analysis of the U.S. Mega Millions must start on October 31, 2017, when lottery officials began implementing the 5/70 format.
UK Lottery
632 draws from October 10, 2015, to November 13, 2021

A Lottery Formula Using A Lottery Wheel
It’s time to level up your playing strategy.
The only way to win the lottery is to purchase many tickets.
For example, in a 6/49 lottery game, one ticket has 1 in 14 million chances. You can improve this when you purchase two tickets, increasing your probability to 1 in 7 million.
Imagine if you buy 10 tickets, then your probability will improve to 1 in 1.4 million.
When buying more tickets, there are two ways to implement this strategy:
- Buying tickets randomly: In this method, we pick combinations randomly. An example of this is through the use of a quick pick machine.
- Buying tickets using a lottery wheel: This method is strategic because you try to trap the winning numbers cleverly through the concept of “covering.”
As a lottery player, you should use the latter method mainly because it is a mathematical approach, as “covering” is a powerful strategy under combinatorics.
In the study of combinatorics, we make selections of elements from a set of objects. From the context of a lottery game, we select combinations from a set of numbers.
For example, in a pick-5 lottery game, you may select a set of seven numbers instead of the usual five numbers. A lottery wheel will generate all possible five-number combinations from the set, giving you a probability of 1 in 665,896 instead of the regular 1 in 14 million.
Intuitively, it’s easier to trap four winning numbers with a set of seven numbers. Right? In this case, you may win multiple three or four matches on several combinations. And possibly winning the jackpot.
However, a lottery wheel can be an expensive strategy.
Increasing your set of numbers means buying more combinations to cover all possible outcomes. For example, choosing ten numbers will produce 252 combinations. The combinations will increase very quickly to 792 if you choose 12 numbers.
To make this covering strategy somewhat affordable, you can use an abbreviated wheel where you end up playing ten lines instead of 252 lines.
However, there’s an ugly truth to using an abbreviated wheel, as you end up with combinations with very low success-to-failure ratios. There’s no point in using an abbreviated lottery wheel when your chances of winning decrease.17
So, with covering strategy, you are faced with a dilemma.
Use the full-wheel, and you will run out of budget. Use the abbreviated version, and you gain little success.
Fortunately, there’s a solution.
Enter the Lotterycodex calculator, the only lottery wheel that combines combinatorics and probability theory in a single system. It analyzes elements in a set, generates all possible outcomes, and separates combinatorial groups based on their success-to-failure ratios, allowing you to play with a mathematical advantage.
Again, Lotterycodex reinforces the importance of the success-to-failure ratio when buying lottery tickets, especially in bulk.
A lottery wheel is designed to help you strategically trap the winning numbers. Using Lotterycodex as your lottery wheel increases your playing strategy by intelligently choosing combinations.
The Lotterycodex Calculator: Making the Lottery Wheel Works for Everyone
Your job as a lotto player is to win the big jackpot and not just get a small prize.
But it isn’t easy to achieve such a goal using the abbreviated system. And it’s expensive when you choose the full wheeling system.
The solution is to find your way in the middle, where you play at a minimal cost and with a better success-to-failure ratio of winning the jackpot prize (not just the lower-tier prizes).
Lotterycodex calculator was created to make it easier for everyone, combining the power of combinatorics and probability theory in one system.
Not everyone is a math prodigy, so a calculator will be a nice thing to have. But even if you understand the lottery formula, you will also want a calculator to avoid the tedious calculation process.
To use the calculator, you will be asked to choose numbers. The calculator will then list all possible compositions from your selection.
Then, using the probability theory, the calculator will separate the dominant combinations, making it easy for you to pick selections. Now, you won’t spend money on those combinations that rarely occur in a draw.
That’s how it works. The Lotterycodex calculator can predict the combinations dominating lottery draws over time. And you don’t need to analyze the lottery’s historical draw results.
The calculator is designed carefully, so you only need to point and click, and a list of combinations will be ready for download. Generating combinations can’t get any easier than that.
How can Lotteryodex help you get the best shot?
Combinations are divided into distinct combinatorial templates. These templates are ranked according to their corresponding success-to-failure ratio.
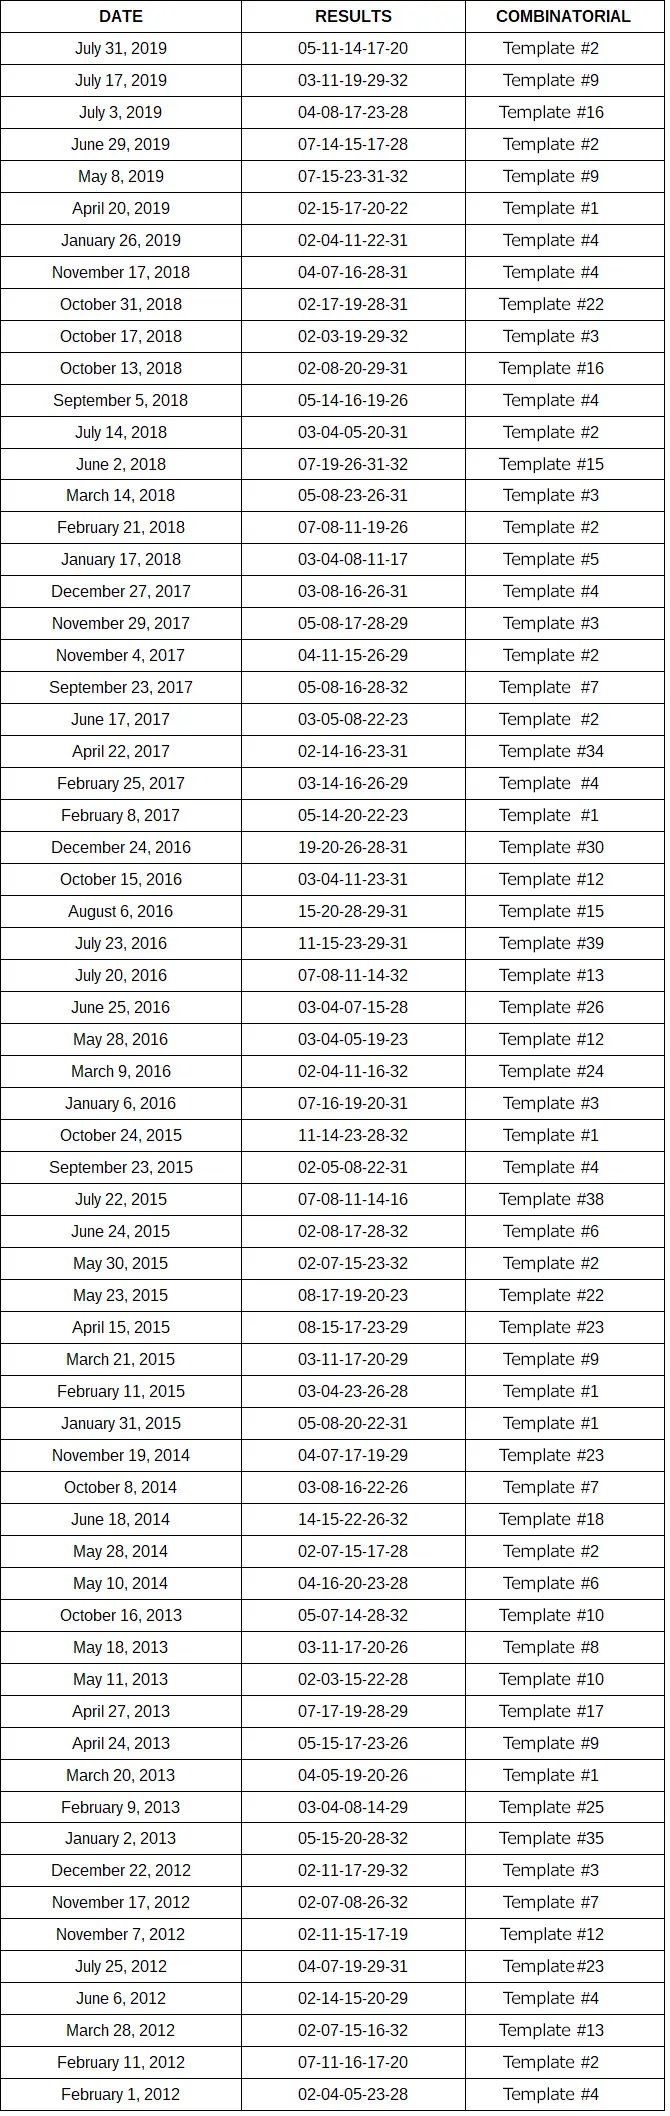
To illustrate, here’s an example of a set of 20 numbers for a 5/32 game.

These 20 numbers have produced 65 winning combinations in 8 years in the Idaho Weekly Grand 5/32 game from February 1, 2012, to July 31, 2019.
According to Lotterycodex calculation, the following combinatorial templates will dominate the list:
| Template #1 | Template #2 |
| Template #3 | Template #4 |
And indeed, the math does not lie.
According to the law of large numbers, the actual lottery results must follow the dictate of probability theory.
As the Idaho Weekly Grand 5/32 draws continue, expect these four templates to dominate the draws.
Indeed, in the actual draws of the Idaho Weekly Grand, the results are dominated by templates #1, #2, #3, and #4.
Here’s the summary of how the first four templates dominated most draws.
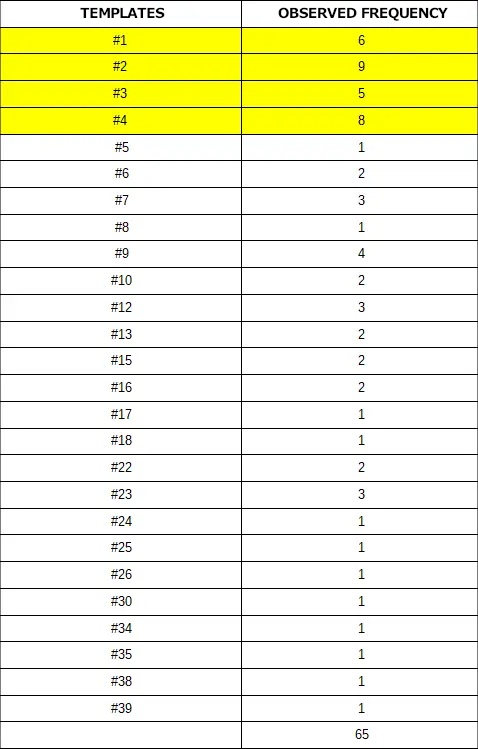
The calculator will tell you accurately and precisely what combinatorial templates will dominate your game. And you don’t need to analyze the previous lottery results to make this kind of high-precision, high-accuracy prediction.
That’s the power of a lottery formula with the right mathematical tool.
You might wonder how Lotterycodex separates the dominant group from any lottery game. Stay tuned because that’s precisely the question we’ll discuss next.
The Best Lotto Numbers To Pick
When selecting numbers, your first step should not be seeking the “best lotto numbers.” Take your time to familiarize yourself with all the combinatorial groups in your lottery game and understand the success-to-failure ratios associated with each.
I know some lotto gurus online recommend that you target the small prizes and win more frequently until you hit the jackpot. I have explained how this method misleads you into thinking that you’re winning when you’re not. That’s not how the lottery works.
If you aim to win small prizes frequently, this free guide is not for you. Please stop reading right now and go somewhere else.
The only responsible way to play the lottery is to “save money” and do your best to “hit” the jackpot.
Now, to win the jackpot, you want the best shot possible.
In short, make an intelligent choice.
The best way to do it is to pick your combination from the dominant group. This provides you with the highest ratio of success to failure.
These dominant groups exist, and the evidence lies in that the lottery obeys the dictate of probability and the law of large numbers or LLN.
What is the Law of Large Numbers?
Wikipedia defines LLN this way:
In probability theory, the law of large numbers (LLN) is a theorem that describes the result of performing the same experiment a large number of times. According to the law, the average of the results obtained from a large number of trials should be close to the expected value and will tend to become closer as more trials are performed.18
This only means that each group will occur very close to the frequency dictated by its probability.
My lottery studies show undeniable agreement between actual lotto results and probability estimation. The agreement between the actual statistics and theoretical calculation proves that the lottery follows the law of large numbers.
How does Lotterycodex determine these dominant groups
I emphasized the benefits of using combinatorics in the previous section. However, combinatorics is not enough. To complete the lottery formula it needs additional support from another branch of mathematics; this is where probability theory can help.
What is probability?
Probability is the branch of mathematics that determines how events will likely occur.19
Combinatorics and probability give us an ultimate lottery formula for getting the best shot possible.
To begin with, we need the right process.
For example, the 1-2-3-4-5-6 line is dominant if we base our conclusions on the odd-even analysis. However, that conclusion is far from the truth because, according to the low/high analysis, such a line has a terrible success-to-failure ratio.
The contradiction between low/high and odd/even analysis reinforces that something is wrong.
The solution to this contradiction is to combine the two analyses. We integrate low/high and odd/even in one combinatorial and probability analysis.
Let’s use the 5/24 lottery system to illustrate the process. We divide the 24 numbers into low and high sets.
| LOW | 1,2,3,4,5,6,7,8,9,10,11,12 |
| HIGH | 13,14,15,16,17,18,19,20,21,22,23,24 |
Then, we further divide the two sets into their corresponding odd and even sets.
| ODD | EVEN | |
| LOW | 1,3,5,7,9,11 | 2,4,6,8,10,12 |
| HIGH | 13,15,17,19,21,23 | 14,16,18,20,22,24 |
Below is what the Lotterycodex combinatorial sets look like for a 5/24 game:
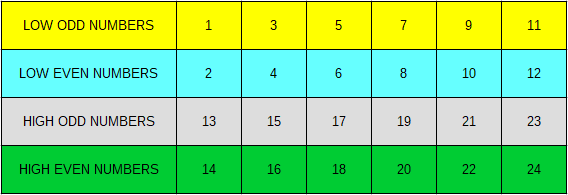
Generated by Lotterycodex Calculator
Those four sets are all we need to execute the lottery formula and produce the corresponding combinatorial templates. Then, we can separate the dominant combinations.
Lotterycodex Templates: A Simplified Approach to Complex Lottery Formula
The results of our combinatorial calculations are what we call Lotterycodex templates. You will use these templates as your guide for number selection. Of course, your goal is to win the jackpot, and therefore, mathematically speaking, you should choose the dominant group to get the best shot possible.
For example, a template can be like 1-low-odd, 2-high-odd, and 2-high-even numbers. Knowing the composition of the combination is crucial in the calculation of probability. That’s why Lotterycodex templates are so useful.
For example, the line 1,2,3,4,5 combination has the following composition:

Notice that this template has three numbers from the low-odd set and two from the low-even set. Of course, 1,2,3,4,5 shares the same composition as other combinations. The following combinations are all under the same template as 1,2,3,4,5:
- 1-7-9-4-10
- 3-5-7-2-6
- 1-5-9-8-12
- 1-9-11-2-10
- 3-7-11-4-8
All combinations under this template exhibit a probability value of 0.0070581592.
In simple terms, the template only occurs about seven times in 1000 draws.
(3-low-odd and 2-low-even) = 1000 x 0.0070581592 = 7.0581592
If you play the above combinations, expect your ability to hit the jackpot only around seven times every 1000 attempts.
Remember this: As a lotto player, you don’t want to spend your money 1000 times to get seven favorable shots. This is not your best shot.
Do you want proof?
Go to any 5/24 lotto game and check the previous results. You will see that a composition of 3-low-odd and 2-low-even occurs approximately seven times in 1000 draws. The actual frequency may not be exact, but notice the closeness in value. That’s how a random lottery obeys the dictate of probability.
That’s the wonder of a lottery formula based on combinatorics and probability. They work together.
Why do they work? Because mathematics is all about precision and accuracy.
You have probably heard many lotto gurus suggest that you avoid the 1-2-3-4-5 combination with a sensible explanation, except that they cannot justify their opinion with calculation.
It is probably your first time understanding why a straight combination is such a bad idea from a mathematical perspective.
In a 5/24 lotto game, some templates have a probability value of 0.0001411632. This group only occurs once in 10,000 draws.
If you have been playing a 5/24 game for many years now, chances are, you have been playing combinations under the uncommon or occasional group. And you aren’t even aware of it.
Using The Lottery Formula Of Lotterycodex
So, what’s the whole picture about the 5/24 lotto game?
There are 42,504 unique playable combinations in a 5/24 lottery game. Based on the Lotterycodex calculation, the 5/24 game has 56 templates.
Of the 56 templates, 4 have the highest success-to-failure ratio. According to the law of large numbers, these dominant templates are bound to happen more frequently and will continue to dominate other templates as draw data gets larger and larger.

Generated by Lotterycodex Calculator
If you want to win the 5/24 game, you should know that your focus should be on templates #1, #2, #3, and #4.
Lotterycodex templates for a 6/49 lotto game
In a 6/49 game, you can choose from 84 templates. Of the 84, only 3 are the dominant ones.

Generated by Lotterycodex Calculator
Lotterycodex templates for a 7/50 lotto game
If you are a 7/50 lotto player, you should know that only 2 are the dominant ones of 120 templates.

Generated by Lotterycodex Calculator
Lotterycodex templates for other lotto games
Combinatorial and probability calculations can be quite complex. Also, the results of probability calculations are always different depending on the lottery format.
There’s no one-size-fits-all calculator. Be sure to use the right one for your favorite game.
If your favorite game is 6/49, then use the 6/49 calculator.
Sometimes, a lotto system has one or two extra balls or bonus numbers. We don’t include the additional number in the probability calculation because it is not mathematically practical.
For example, if your game is the Euro Millions or the Euro Jackpot, you pick five numbers from 50 plus two extra balls. Your calculator should be the 5/50 calculator. You don’t count the two extra balls.
The right calculator for the US Powerball is the 5/69 calculator.
For the Mega Millions, you pick the 5/70 calculator.
For Canada Lotto 6/49, you pick the 6/49 calculator.
Whatever your lotto is, always use the right calculator for your game.
The clue is simple. Know the primary numbers in your game, and don’t count the extra ball.
If you are ready to see the Lotterycodex templates of your favorite lotto game, here is the complete list of Lotterycodex calculators for your perusal.
Win the Lottery With the Right Lottery Formula
To win the jackpot, it doesn’t matter what individual numbers you choose to play the lottery. You can play those so-called unlucky numbers because the lottery doesn’t care whether they are true.
You can play special dates or birthdates if you understand how the lottery formula works.
Combinatorics and probability are difficult subjects, so a Lotterycodex calculator will save you from all these complexities. You don’t need a math degree to win the lottery.
I have important reminders, though.
The lottery may be cheaper than any other form of gambling, but it might lead you to a lottery addiction if you are not careful.20
Ultimately, the budget will dictate how many lines you can play. Remember that winning in the lottery takes a long streak of losses. Setting a specific goal and implementing it with money-saving habits is essential.
I am here to show you the facts. You must understand that buying more tickets is part of this lottery formula; there’s no other way. However, buying more lottery tickets tends to become expensive and risky in the long run. Therefore, a lotto syndicate should save you in that regard.21
But more than that, you must look at the whole lottery. So, I propose the following dos and don’ts:
Dos
- Play responsibly. The lottery is entertainment only. It’s not a substitute for a full-time job.
- Use the right lottery formula to strategize your game. Learn how to take advantage of combinatorics and probability theory.
- Make a game plan. Failure to plan is a surefire plan to fail.
- Do you hate math? No worries. Use a Lotterycodex calculator.
- Buy more tickets to increase your chances of winning (but save money first).
- Join or start a lotto syndicate to keep everything inexpensive.
- Play a lottery with lower odds to win easily.
- Bet only with the dominant combinations.
- Accept that strange combinations do occur in lottery draws. True randomness must allow a peculiar event, coincidence, and even miracle to happen.
- Save a little money for lottery entertainment. And put the bulk of your savings into your retirement fund.
- Play the same list of combinations.
Don’ts
- Don’t think it’s easy to win the lottery (it’s not)
- Don’t predict the next winning numbers (you can’t)
- Don’t beat the lottery’s odds (you can’t change the odds).
- Don’t use a lottery formula based on superstitions.
- Don’t treat numbers and combinations the same way (they are different).
- Don’t forget to check your results.
- Don’t forget to invest in yourself and your future.
- Don’t rely on the lottery to better your life.
- Don’t give up.
Questions and Answers
Lotterycodex’s lottery strategies primarily utilize probability theory and combinatorics. These mathematical principles offer a more logical and systematic approach to selecting lottery numbers, using the success-to-failure ratio as a mathematical guide.
Lotterycodex primarily aims to debunk the misconception that certain number combinations or lucky numbers have a higher chance of winning. Lotterycodex emphasizes that in a fair and random lottery draw, all combinations have an equal probability of selection. This challenges the common belief that past draws influence future outcomes or that certain patterns or numbers can increase the odds of winning. Lotterycodex advocates for a more analytical approach based on mathematical principles, as opposed to relying on superstitions or unfounded beliefs in lottery number selection.
In lottery strategies, the covering concept involves selecting a set of numbers and creating combinations that encompass all possible arrangements. This method increases the likelihood of trapping the winning numbers by playing multiple combinations, potentially winning lower-tier prizes and even the jackpot. It strategically distributes chances across a wider range of numbers rather than focusing on a few random selections. This strategy is based on the mathematical principle of combinatorics.
Additional Resources
- Top 10 Lottery Strategy Myths Debunked [↩]
- Lottery Tips: What Works and What Doesn’t [↩]
- The Truth About Winning Small Prizes in the Lottery [↩]
- The Illusion of Control [↩]
- What is Confirmation Bias? [↩]
- Illusion of control [↩]
- The Mega Millions jackpot is over $500 million — we did the math to see if it’s worth buying a ticket [↩]
- Play the Lottery Responsibly [↩]
- A Visual Analysis of a True Random Lottery With Deterministic Outcome [↩]
- Probabilitycourse.com: Law of Large Numbers [↩]
- Is it rational to trust your gut feelings? A neuroscientist explains [↩]
- Law of Truly Large Numbers [↩]
- Math Explains Likely Long Shots, Miracles and Winning the Lottery [↩]
- Odds, Probability, and the Lottery [↩]
- The Difference Between Probability and Odds [↩]
- The Lotto Secret: Three Math Strategies for Winning Revealed [↩]
- Lottery Wheel: A Clever Mathematical Strategy That Works [↩]
- Law of Large Numbers [↩]
- ScienceDirect: Probability Theory [↩]
- Lottery Addiction – Signs, Dangers and Where To Get Help [↩]
- Syndicates: There’s Strength in Numbers [↩]

Es realmente asertamte que porcentaje de probabilidad daría el programa o la calculadora gracias.
So what do you suggest for the bonus 2 numbers (1-12) for EuroJackpot? How can I make it easier on myself when choosing a combination?
We can only perform combinatorial and probability analysis on the primary five numbers. There’s nothing we can do about the bonus numbers because it’s not practical, mathematically and financially speaking.
Good information keep on updating us.
A bit too much to absorb in one go especially if you’re not very familiar with the deeper end of mathematics
Thank you Vernon for sharing your thoughts. Combinatorial math and probability theory are not easy subjects to deal with but it’s really necessary to explain how they work. I know that math can be very intimidating and exhaustive so I created Lotterycodex calculators to save lotto players from all these conundrums in mathematics. Nonetheless, I still recommend that lotto players do make effort to understand how math works in the lottery. But at any rate, if one is not interested to know the nifty aspect of calculation, I offer Lotterycodex calculator as a convenient tool.
Very interesting article and very well written.
The division of the balls based on the numbers printed on them is artificial and it is the same as dividing a group of 30 balls with different colors/letters into two subgroups and then selecting 3 balls from each subgroup.
So, any division of the main group of the balls into subgroups will have same probability and same odds. in short – the combination 1,2,3,4,5,6 is not better or worse than a combination of balls identified by their colors like: blue-yellow-green-black-white-red.
I do agree with the principle of playing games with less numbers to pick from, because of two combined reasons:
One – with small group of balls we have smaller absolute value of losing events (i.e. ‘bad’ combinations/odds) than the absolute value of losing events of a larger group of balls to pick from. Thus, with smaller group of numbers we have higher winnings frequency because of the smaller sample size.
Two – we do have control whether we participate in the next draw/s or not. so, If we choose for example a combination that have a probability of 1/20 to win a small prize, and that specific combination didn’t won (even not small prize) in the last 20 draws, allegedly, it will be recommended to use this combination in the next draw.
I believe we can use the lottery codex and add some factors from the schrodinger equation to predict the drawing. Kinetic energy, weight of each ball & such. If you would be interested in hearing about this please let me know.
Hi Rodney,
I am interested in the topic your brought up. can you please elaborate more or suggest references?
Thanks
Too complicated. Whatever you do, you can only predict or describe the outcome of a lottery game to an extent based on a large number of drawings. In a truly random game like the lottery, where all balls have equal weight, the same textures, and equal size, everything is fair. You cannot predict the next winning numbers.
Do calculators works for foreign (Brazilian) lotteries?
Yes
Do you have a strategy or statistical combination more apt for winning for pick 3 or pick 4 games?
Sorry, we only focus on traditional lottery draw games.
This Is a fantastic article. One of the best written since it is very clear and concise. However I was wondering on how else to elaborate on narrowing down randomness beyond the methods you mentioned in the article and the one you mentioned in the comment section about “schrodinger equation to predict the drawing. Kinetic energy, weight of each ball & such.”
(WHICH BTW, I would love to learn your thoughts In regards to how you see it working and how to put it to use).
However, what else may be interesting to research is finding out more about RNG systems lotteries use such as,(PRNGs, TRNGs) or a mix of them and the mechanisms they use to generate the seed number for the winning draws. Binary is of interest to me as well since (if i understand correctly they use this overlayed on top of atmospheric noise then feed it to a TRNG system to find a seed number then use a PRNG system to help scaling etc.
It may be impossible to find the seed number without knowing the algorithm used in the PRNG/TRNG for (let’s say 6/49) and not definitive to find the real world random event they use (much less calculating a pattern in it, such as (atmospheric noise)…… BUT, what if it is not? I want to know is there a pattern in atmospheric noise? (It is the likely candidate used for starting in generating seed values) Can we derive the seed number (or atleast come to a closer idea of what the seed number may be based on patterns)?
Would love to hear what you think about this.
Too complicated to apply to lottery drawing. Please remember that all balls in the urn have the same texture, size, and weight.
I need this
I love the math that there is behind it and how it is explained, however isn’t there some logic to use statistics as well? At least to derive some patterns for frequencies of groups of numbers that might oscillate as a function of time, or to see whether winning numbers follow a certain type of distribution according to the sum of all numbers for example?
Any statistical analysis of the lottery will make no sense because all numbers will converge to the same probability value according to the law of large numbers. The lottery is finite, and therefore, you have adequate knowledge of the game’s composition. Any questions you ask are probability problems to solve rather than statistical.
The lottery in canada is fixed for the east to win 9 out of 10 since ndp support the eas BC get a share now in 1 month its Ontario Quebec BC. Bring back live draws
Why not use the expected value of a ticket to decide
When and what lottery buy into? Seems that a total prize jackpot of $100 million is a better time to buy a ticket than when the total is $20 million (for LottoMax).
No matter the prize, you don’t get a positive expected value when buying lottery tickets.