
Persistence and consistency are worth examining through the lens of probability — not because they change the odds of any single draw, but because the law of large numbers only describes long-run behavior across many trials. A single ticket in a single draw is one data point. Combinatorial frequency distributions only become observable across thousands of draws. That is a mathematical property of how probability works, not a recommendation for how to play.
That said, let’s be honest about what the math actually says. No amount of persistence and consistency can predict a random draw. The lottery is built on true randomness, and no system changes that. What persistence does is give probability enough room to behave according to theory — nothing more.
Table of Contents
A Letter from a Determined Lottery Player
Dear Edvin,
I purchased your 6/46 lottery calculator and am really enjoying it. I play the NJ 6/46 jackpot, and I’m determined to take home the jackpot. My strategy is to play with persistence and consistency, focusing on the top 6 templates, which have a cumulative probability of approximately 31%. I mean to expand my selection to the top 14 or 18 templates to get more probability of a match, but I’m concerned about diluting my chances by not using the most probable templates. Would it be more effective if I stick with the top 6 templates? Thank you for helping.
The reader’s question touches on combinatorial templates — groupings I developed through independent research beginning in 2017. In the Lotterycodex framework, templates classify combinations by their combinatorial composition using the LOW-ODD, LOW-EVEN, HIGH-ODD, and HIGH-EVEN partitions of the number field. The frequency ratio assigned to each template describes its expected long-run relative occurrence across many draws under the law of large numbers — not a prediction of any single draw outcome.
Does Expanding Templates Dilute Your Chances?
This is a fair question, and the math answers it clearly. Probability does not care which templates are used. What it does care about is how many tickets are purchased.
If 14 tickets are bought, they can be spread across 14 templates — one line per template. Or the same 14 tickets can cover 7 templates with two lines each. Both produce the same number of tickets, so the underlying probability is identical. Expanding templates does not dilute the chances. It redistributes coverage across a wider set of combinatorial compositions.
More tickets cover more of the outcome space. The key variable is always the number of tickets, not which templates hold them.1
In the Lotterycodex framework, the frequency ratio for each template describes how often that combinatorial composition is expected to appear across large numbers of draws. That description becomes more observable as more draws accumulate — which is what the law of large numbers predicts.
In the Lotterycodex framework, I use “frequency ratio” rather than “odds” to describe how often a combinatorial composition appears over many draws. The word “odds” carries a common meaning tied to winning or losing, which does not apply here. A frequency ratio describes relative long-run occurrence across the total combination space — not a probability of winning any particular draw, and not a prediction of any result.
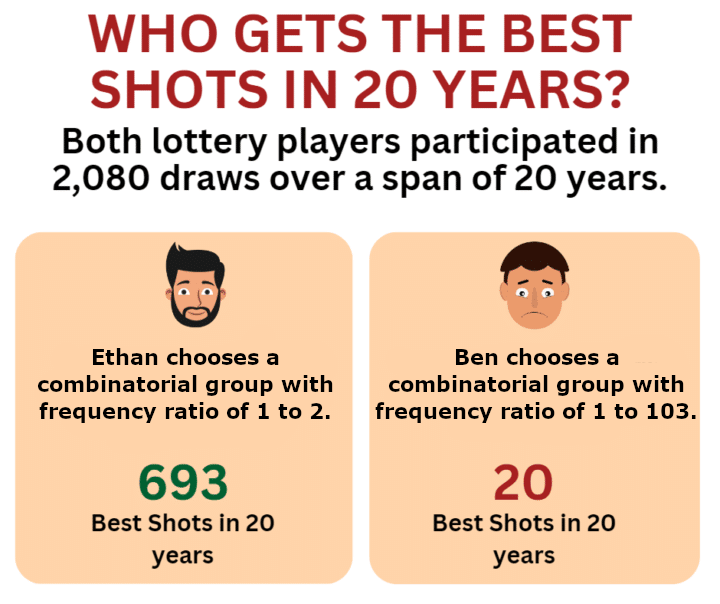
Templates can be included or excluded based on budget and the number of tickets purchased. The math does not change either way.
The Math Behind a Long Streak of Losses
Here is something most players underestimate: the lottery is built for long losing streaks. That is not a flaw — it is what the math predicts.
A jackpot may never be won in a lifetime of play. It may also be won more than once. In a truly random game, both outcomes exist within the range of mathematical possibility. No one can tell you which will happen, because that is precisely what randomness means.
The law of large numbers describes long-run behavior, not individual results. More draws give the probability model more trials to reflect its theoretical behavior.2
Here is what the numbers look like for the NJ Pick 6 game. With one ticket per draw, the probability of losing the jackpot in a single draw is:
P(losing the 6/46 jackpot) = (9,366,818/9,366,819) ≈ 0.999999893
Over 100 consecutive draws with one ticket each time, the probability of losing every draw is:
P(losing 100 consecutive times) = (9,366,818/9,366,819)100 ≈ 0.999989324
The losing probability decreases and the winning probability increases as more draws are played. The improvement is real. It is also minuscule. That is the honest picture the math gives — not discouraging, just accurate.
Ticket Volume and Probability: What the Math Shows
Buying more tickets is the only mechanism that mathematically increases coverage of the outcome space. Superstition, hot and cold picks, lucky numbers — none of these have any effect on a random draw.
Each draw is independent. The fundamental probability of any draw does not change based on what was played before or how consistently a particular combinatorial composition has been selected. Under the law of large numbers, frequency distributions for combinatorial groups converge toward their theoretical proportions over many draws — but this describes long-run statistical behavior, not any individual result.
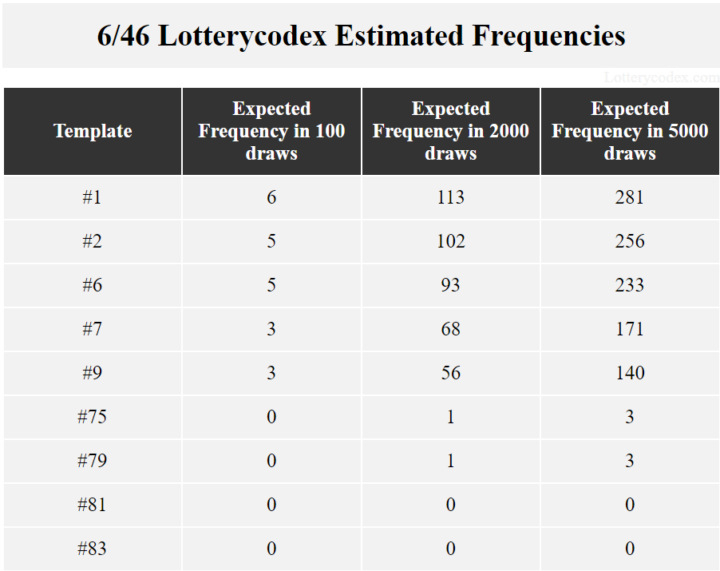
In my analysis of the New Jersey Pick 6 game using the Lotterycodex calculator, Template #1 has a frequency ratio that corresponds to roughly 6 expected occurrences within 100 draws, based on its combinatorial composition. Template #83 falls into a far rarer group, expected to appear much less frequently across thousands of draws. The table below shows these estimated frequencies from that analysis. Read How to Win the Lottery: 7 Things You Can Actually Control
Playing 14 tickets in a single draw gives a jackpot probability of approximately:
14/9,366,819 ≈ 1/669,059
That is a jackpot probability of approximately 1 in 669,059, compared to 1 in 9.3 million with a single ticket. The improvement is real and mathematically straightforward.
Ticket Count and Budget: The Mathematical Relationship
More tickets in a single draw increase coverage of the outcome space more efficiently than the same number of tickets spread across many draws. A covering structure — such as a lottery wheel — can reduce redundant combinations and distribute tickets more efficiently across the outcome space. Full wheels covering many numbers require purchasing a large number of tickets.
A lottery syndicate is a structure where multiple players pool funds to purchase more tickets collectively. This increases the number of combinations covered without changing the probability structure of the game. The odds remain the same.1
The lottery cannot be predicted. The odds are astronomical. That is not a limitation of any particular approach — it is the mathematical structure of the game. Lottery participation is entertainment. The expected value is negative over the long run. A ticket purchases participation in a random draw, nothing more.
The lottery is random. A ticket is the price of participation, and participation is all a ticket guarantees.
Understand Lottery Games Using Math-Based and Data-Driven Analysis
 Explore the Lotterycodex Calculator
References